
Below a collection of some of our best images recorded with atomic force microscopy and simulations performed with finite element analysis.
Static AFM, bio samples
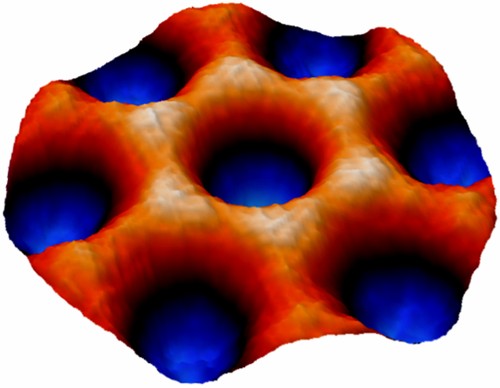
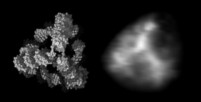
Averaged AFM image from a hexagon formed by clathrin proteins. The images was reconstructed from multiple AFM scans. The width of the hexagon is 30 nm and its height is 12 nm (Dannhauser et al. 2015).
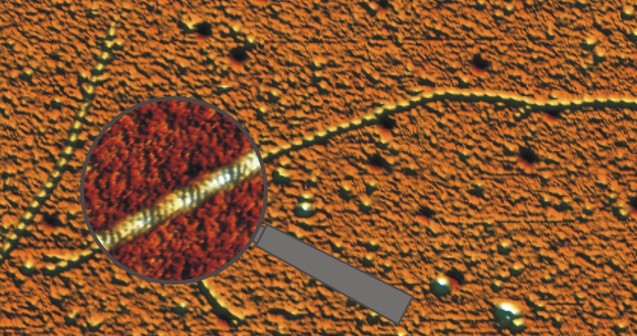
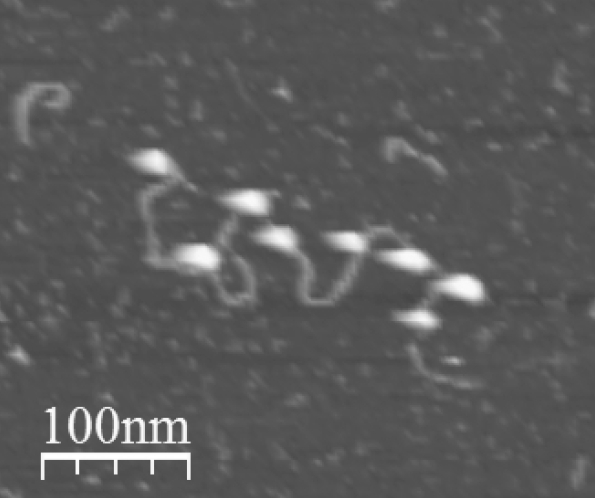
Single actin filaments scanned in liquid with monomer (4 nm) resolution. With this technique we found that the malaria parasite actin assembled with a longer helical repeat than the mamalian actin (Schmitz et al. 2010).
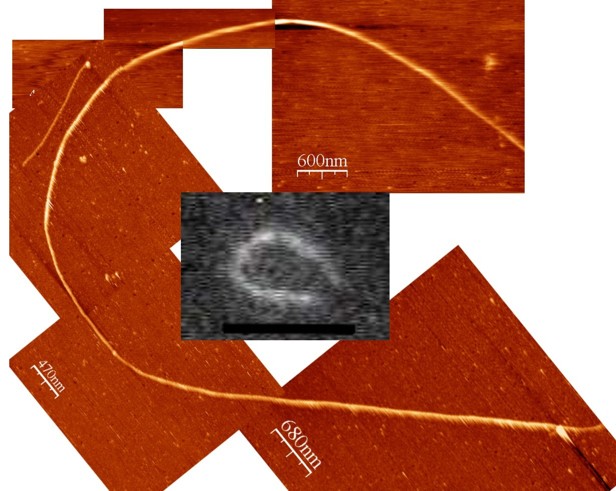
An actin filament simultaneously imaged with total internal reflection fluorescence microscopy (the inset grey scale image) and AFM. This combination of techniques allows us to localize and identify our samples (Iwan Schaap 2006).
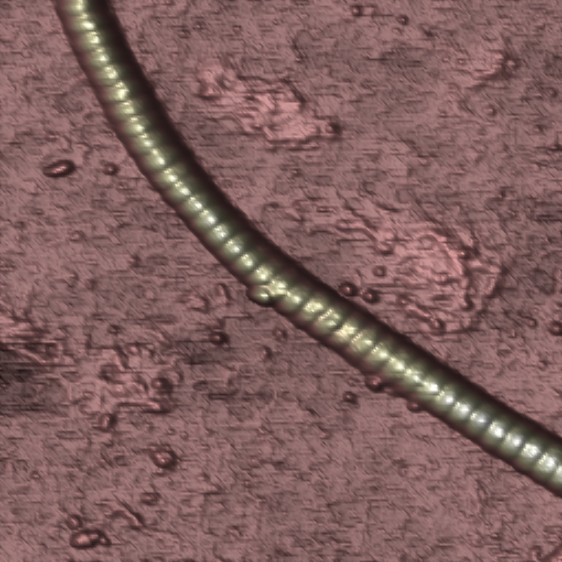
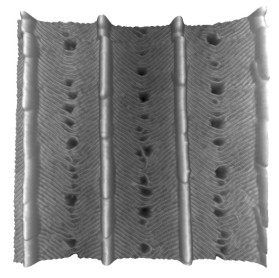
Reconstituted collagen filament showing the typical 68 nm banded pattern, imaged in air (Paula Sánchez 2013).
One of the first high resolution images of a microtubule imaged with AFM in liquid, single protofilaments are visible (Schaap et al. 2004).
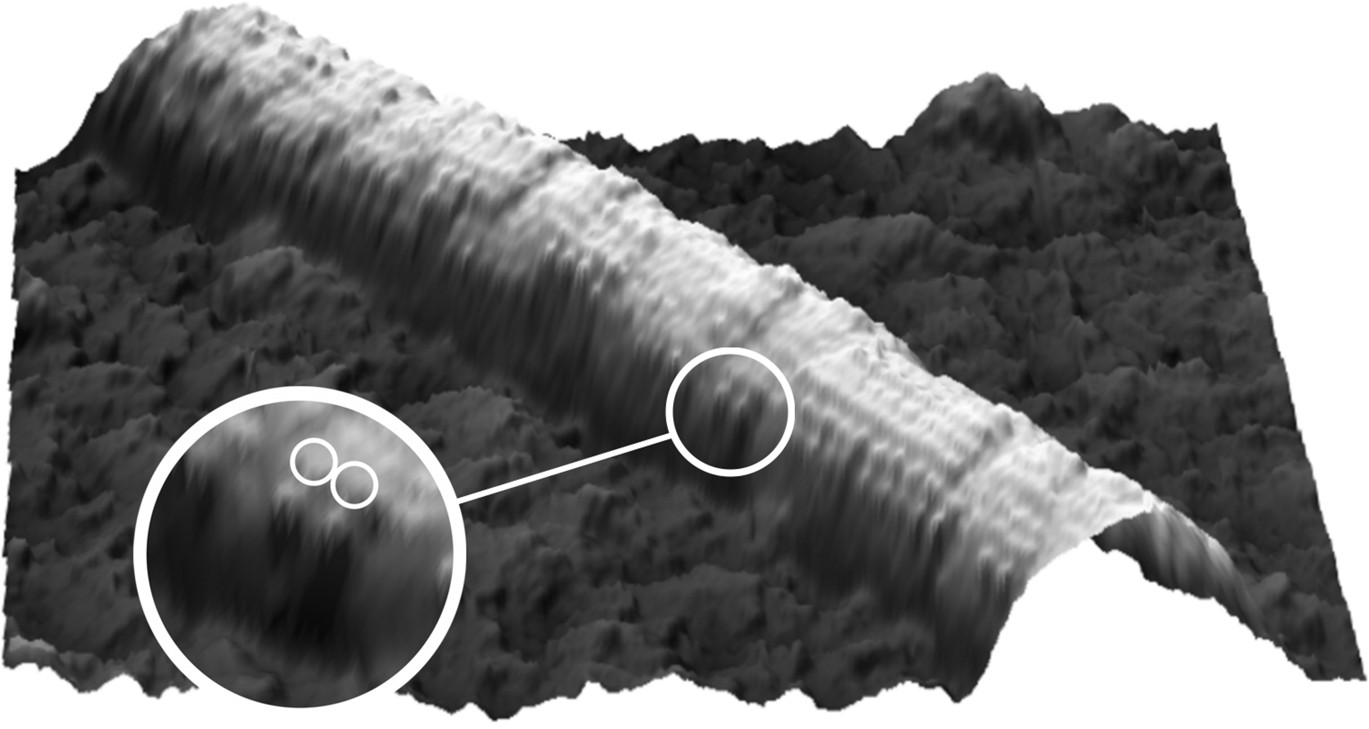
Microtubule decorated with kinesin motors in presence of AMP-PNP. The motors are vissible as blobs on the microtubule. Both heads of individual motors can just be distinguished (Schaap et al. 2007).
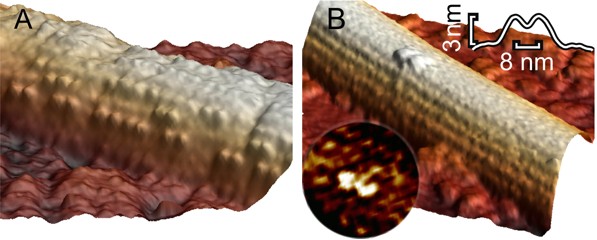
Microtubule decorated with kinesin motors in presence of AMP-PNP imaged at higher resolution. The right image shows a single kinesin motor bound with both heads onto one protofilament. (Schaap et al. 2011).
 |
 |
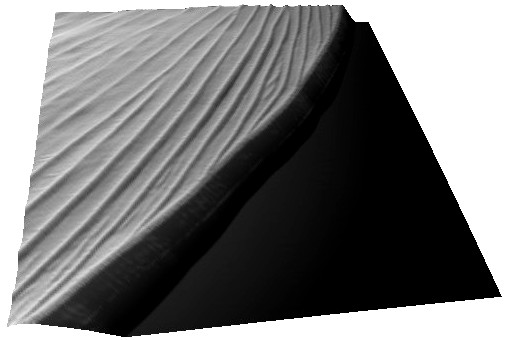
Right: Zooming in reveals a 168 nm vertical periodicity, which is in part responsible for the apparent colour of the wing (Bodo Wilts 2009).
At the left an atomic prediction of a DNA tetrahedron with a rib-length of 6 nm. At the right an AFM scan in liquid of the same structure obtained with a 2 nm sharp AFM tip (Goodman et al. 2005).
DNA + nucleosomes on mica in liquid (Jan Knappe & Szabolcs Soeroes 2010).
Self assembling 2D protein crystal on a lipid bilayer. The image size is 250 x 250 nm and the lattice periodicity ~5 nm (Frédéric Eghiaian 2012).
Static AFM, non-bio samples
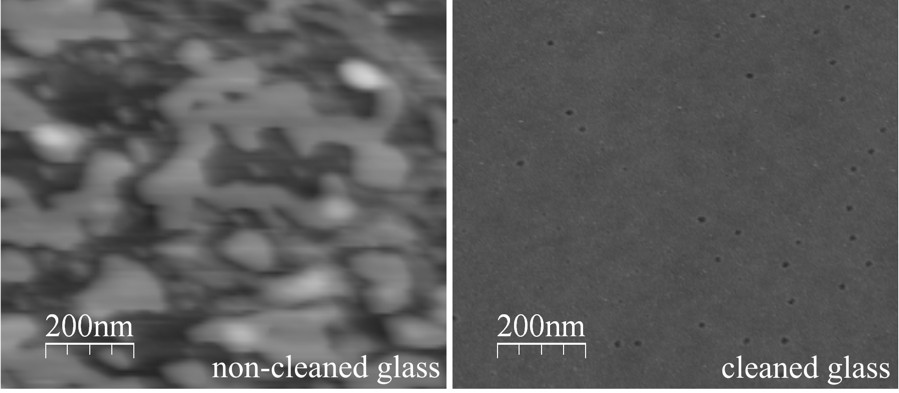
Microscope coverslip before and after cleaning (Eghiaian & Schaap 2011).
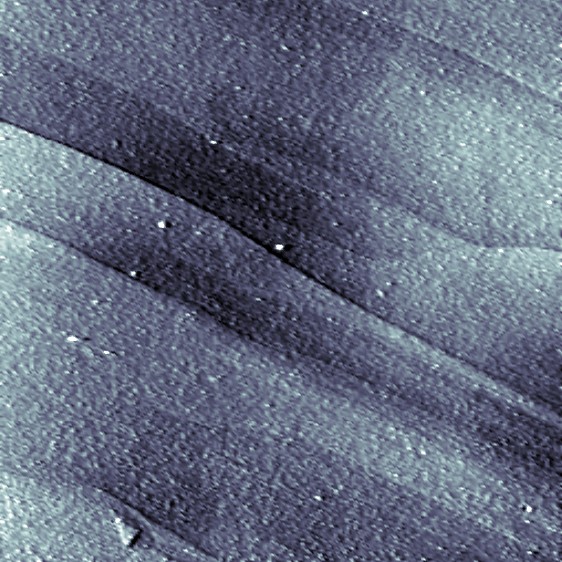
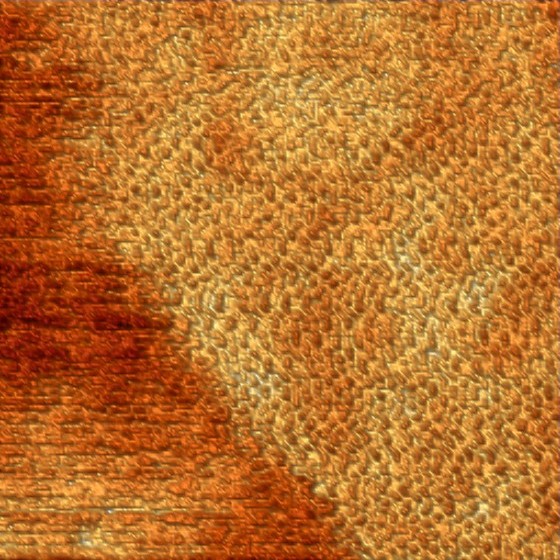
A 3 x 3 μm scan of a HOPG surface. The single layers are clearly visible (Iwan Schaap 2011).
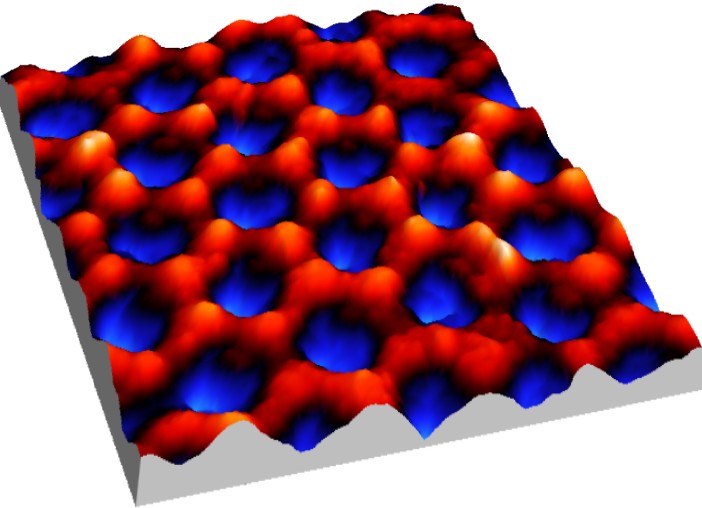
Nano porous alumina formed by anodization, the spacing is 100 nm (Iwan Schaap 2007).
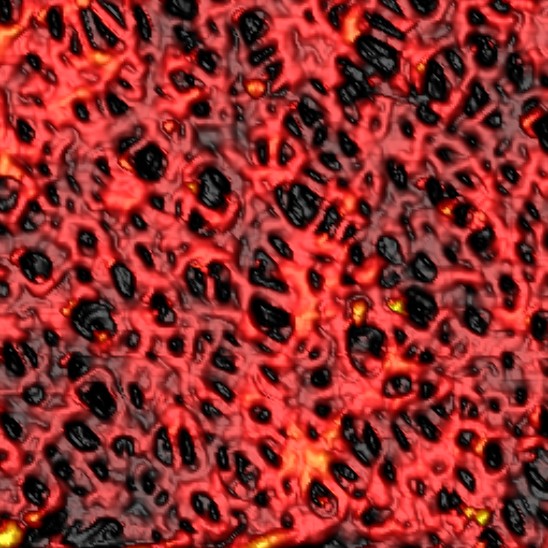
A 15 x 15 μm segment of a filter membrane (Iwan Schaap & Sai Li 2011).
AFM tip mounted at the end of an cantilever (Olympus BL150) as seen through a 100x, 1.49NA objective. The 7 μm long tip was touching the microscope coverslip and is pointing towards the viewer (Kai Bodensiek 2012).
Dynamic AFM
Single kinesin motor moving along the microtubule at 1 µM ATP. Both heads of the motor are clearly visible (Schaap et al. 2011).
Two single kinesin motors moving along a single protofilament (Schaap et al. 2011).
An influenza virus that gets damaged during AFM imaging (Frédéric Eghiaian 2011).
Dynamics of DNA loosely bound to a mica surface (Sebastian Hanke 2011).

Sub-second imaging of DNA (Sebastian Hanke 2011).
Laser trapping
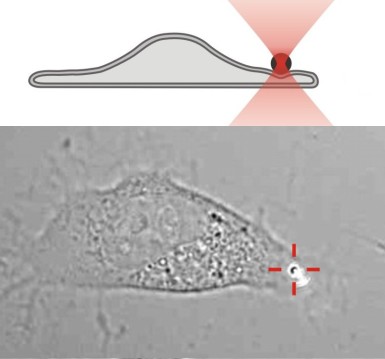
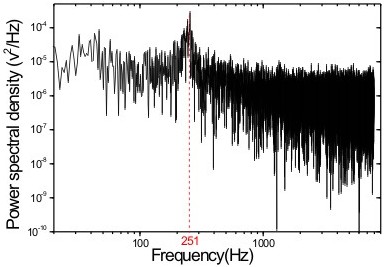
The local elasticity of a fibroblast is measured by pushing a 800 nm diameter bead against the cell (Paula Sánchez 2011).
 |
 |
Finite element analysis
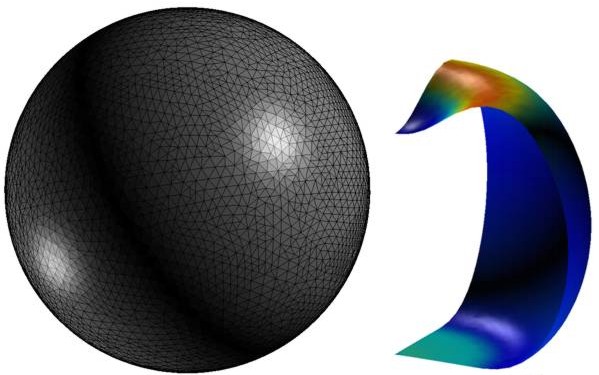
Finite element simulation of a deformed liposome that was used to compute the membrane bending rigidity (Li et al. 2011).
Finite element simulation of the radial indentation of a hollow cylinder, this was the initial model that was used to understand the indentation of microtubules by AFM (de Pablo et al. 2003).
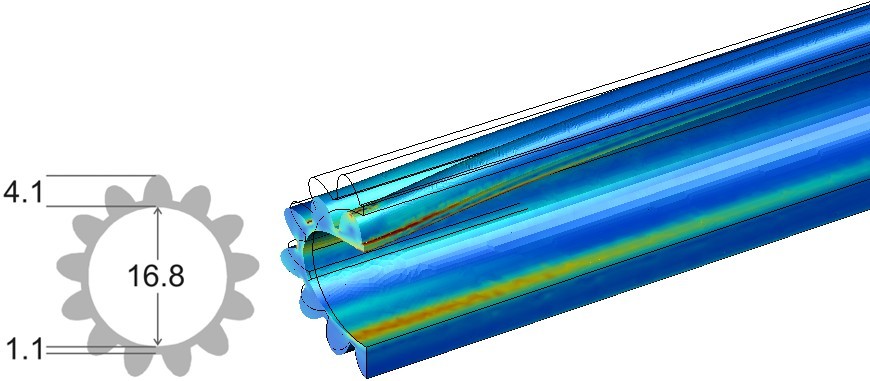
A more advanced model of the microtubule in which also the protofilaments are included (Schaap et al. 2006).
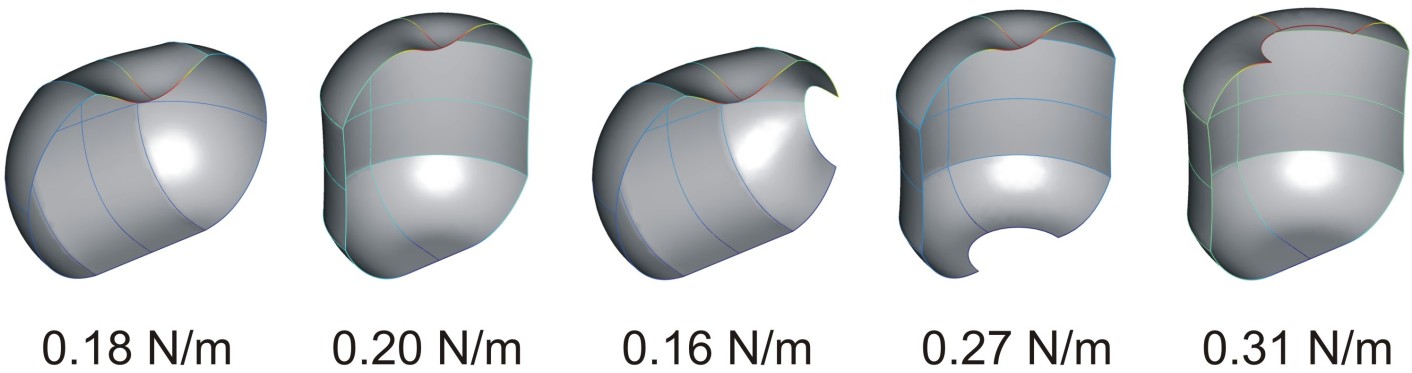
Finite element simulation of the stiffness of a phi29 virus in different orientations, with and without defects (Carrasco et al. 2011).
Computed animation of the deformation of the phi29 virus. The height is 42 nm, and the elastic modulus of the spherical end-caps is 6x higher than that of the cylindrical part (Schaap 2012).
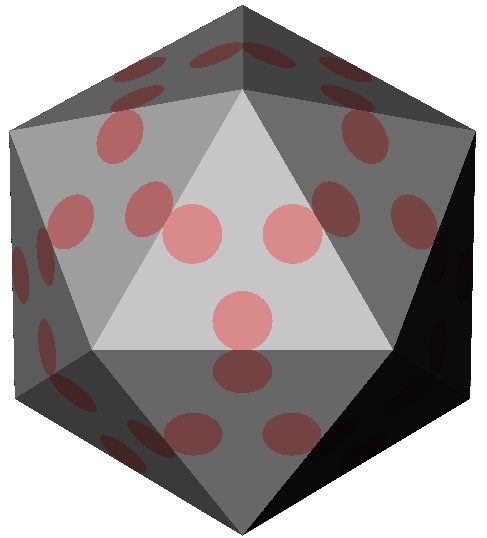
A model of the protein shell of the icosahedral parvo virus. The pink circles represent the local reinforcemenst made out of DNA. These DNA patches increase the stiffness of the virus up to a 2-fold (Carrasco et al, 2006).
A simulation that was used to understand the deformation of the DNA tetrahedron under load. The length of the ribs is 6 nm (Goodman et al. 2005).